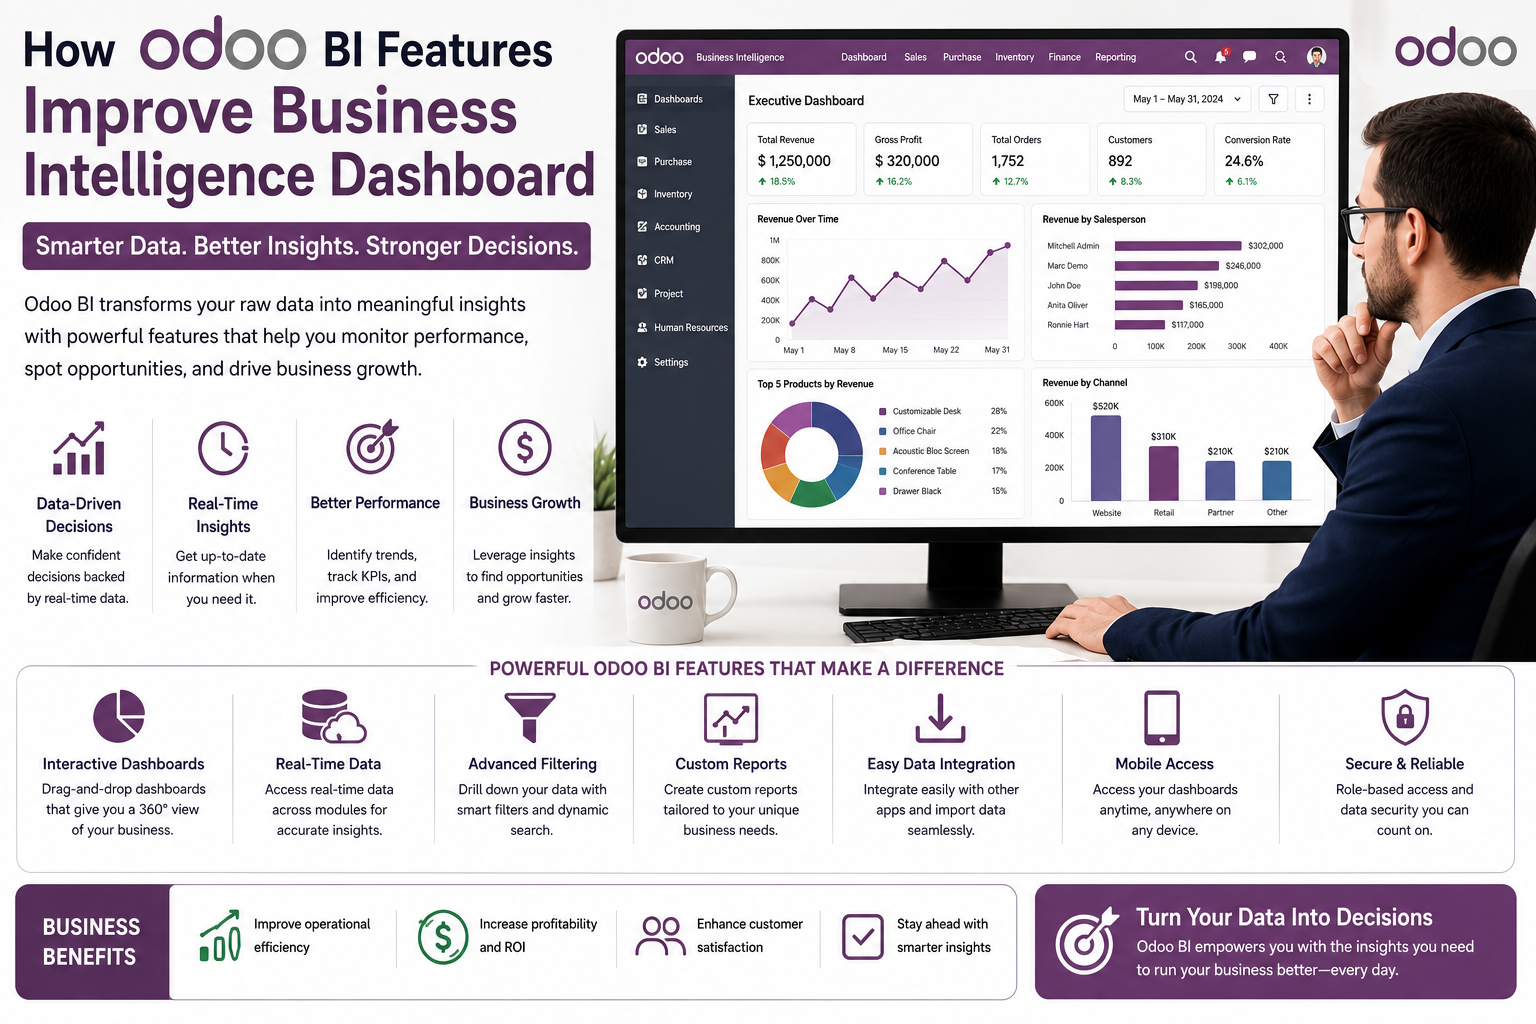
Business intelligence has turned into some kind of necessity for companies that want to choose what to do next using solid data , not just gut feeling. As a business keeps producing lots of information from sales, accounting, inventory, manufacturing, and customer interactions, trying to analyse it by hand becomes harder and slower . And the moment it turns into a bunch of scattered files , you start losing time and accuracy. That’s basically where an Odoo business intelligence dashboard comes in , it takes the raw stuff and turns it into reports people can actually understand, with clear visuals.
The strong Odoo BI features help organisations keep an eye on key performance indicators, notice trends early and lift operational efficiency. Instead of jumping between separate modules, plus spreadsheets , the people making decisions get real-time dashboards that put the important business insights in one place. This article, will explain how Odoo BI features make business intelligence dashboards work better, and how they support smarter business growth, day after day.
What Is an Odoo Business Intelligence Dashboard?
An Odoo business intelligence dashboard is kind of a centralised reporting interface that gathers information from multiple Odoo modules, and it then shows it via interactive charts, graphs, tables, plus key performance indicators. Instead of opening a separate set of reports for sales, accounting, inventory, or purchasing, users can keep an eye on all essential metrics from just one place.
This dashboard updates automatically whenever new transactions are recorded in Odoo, so managers get instant access to current business performance, no waiting around. It removes the lag tied to manual reporting, while still giving better visibility into how the company is really running. In practice businesses can spot strengths weaknesses and opportunities faster without spending hours polishing reports or stitching data together.
Real-Time Data Collection with Odoo BI Features
One of the most valuable Odoo BI features is real time data processing, like it just happens. Each transaction that gets typed into the ERP system right away becomes available for reporting, so your dashboards stay in sync with what is actually going on. If a sales order is confirmed, an invoice is paid, or the inventory levels shift, then the dashboard reacts and updates automatically.
With this kind of live insight, the management team can react quickly to market swings and operational issues. Instead of waiting on reports that are generated at the end of the week or month and are already kind of behind, a company can watch the progress through the day, and then decide sooner, using information that is more precise because it is the current one.
Interactive Visualisations Improve Data Understanding
Large datasets can get kind of tricky to interpret when they show up as those long spreadsheets or boring static reports. With Odoo BI , the whole thing gets smoother , because it takes complicated business info and turns it into interactive visualisations, so analysis feels a lot less painful.
In practice, users can look at the data using pie charts, bar graphs, line charts, pivot tables, heat maps, plus KPI cards. These visual layouts make it easier to compare results across departments, spot shifts over time, and even recognize odd or unusual patterns. And then you get interactive filters, which let people dig into the numbers from different angles. This way decision-makers can grasp how the business is doing, without needing advanced analytical skills.
Centralised Reporting Across Business Departments
Businesses often get stuck because info ends up sitting in separate systems , or it’s kind of walled off inside different departments. Like, the sales team might use one reporting flow while finance has another, and the inventory managers use yet another way of looking at things. With all that separation, it’s tricky , maybe near impossible, to see the whole business performance in one coherent view.
An Odoo business intelligence dashboard kind of stitches that together. It brings data from multiple Odoo modules into a single reporting platform, so you can actually analyse sales alongside accounting, purchasing , inventory, CRM, manufacturing, human resources, and project management without bouncing between places. That one unified method boosts cooperation across teams while also giving the executives a solid, full overview of how the organization is really doing.
Customisable Dashboards for Different Business Roles
Different employees will need different business insights, kind of like it’s not always the same story. For example a sales manager tends to focus on revenue and how customers are performing, while the finance manager monitors cash flow and profitability. Warehouse managers usually care about inventory metrics, whereas executives want the big picture overall company performance.
With Odoo BI features, businesses can craft customised dashboards that fit each role and responsibility, not just generic layouts. Every user can reach the reports that actually match what they do day to day, so productivity gets better and there is less unnecessary info overload. Also this customisation makes it possible for organisations to spotlight the KPIs that matter most to certain departments, without drowning everyone in everything at once.
Advanced Filtering and Drill-Down Capabilities
Business dashboards are way more useful when people can look into the numbers with more granularity, not just glance. In Odoo BI you get advanced filtering plus drill down options, so users can go from a high level summary report into the detailed transaction records in only a few clicks, kind of seamless.
Like, say monthly sales drop in a sudden way. Managers can then dig into how each region is doing, or check product category performance , customer segments, and even trace it down to a specific sales representative to find the root reason. With this extra layer of analysis, organisations can solve issues faster and also sharpen their strategic planning, usually without losing time.
Better Forecasting with Historical Business Data
Historical business information plays a key role, in trying to predict future performance, kinda like having clues in the past. Odoo business intelligence dashboards store and analyse historical records together with what is happening right now in the business , so forecasting becomes more dependable.
With time companies can look at seasonal patterns, customer purchasing behaviour, inventory demand, revenue growth, plus operational efficiency all over a longer stretch. From there they get useful views that aid smarter budgeting, inventory planning, workforce allocation, and sales forecasting. When the predictions are solid, businesses can lower risks, and in the same motion prepare better for upcoming opportunities.
Automated Reporting Saves Time and Improves Accuracy
Manual report prep really takes up a lot of employee hours while it also quietly makes human error more likely. When teams export spreadsheets, merge data inputs, and then rework charts by hand, the whole thing can drag out and business decisions end up delayed.
With Odoo BI, a lot of that reporting workflow is handled automatically. Dashboards can be produced straight from live ERP data, instead of assembling everything piece by piece. You can set up scheduled reports so they run on a plan and get shared with the right stakeholders at predefined times. This kind of automation boosts consistency in reporting removes the rechecking of the same tasks over and over, and it leaves staff to focus on higher value work rather than tedious data preparation.
Improved Decision-Making Through Actionable Insights
Business intelligence is valuable, but only if it actually pushes you toward better decisions. The Odoo BI features kind of help by sharing actionable insights, they do it through accurate, timely, and meaningful business data so it backs strategic planning and day to day operational upgrades.
Managers are able to keep an eye on profitability, customer behaviour, inventory turnover, production efficiency , purchasing costs, and even employee performance all from one integrated dashboard. When trends show up early, organisations can respond proactively rather than waiting until issues become, noticeable and bigger. In the end this data led approach cuts down uncertainty and it builds more confidence in business decisions.
Why Odoo BI Features Are Essential for Modern Businesses
Modern organisations try to compete in markets that keep shifting, and honestly quick informed decisions matter a lot for long term success. An Odoo business intelligence dashboard gives companies real time reporting , plus interactive visuals, automated analysis, and one central place to reach company wide information, so it feels more streamlined.
The broader Odoo BI capabilities support improvements in day to day operational efficiency, they also lift reporting accuracy a bit , strengthen forecasting, and back strategic expansion. When Odoo turns complicated ERP data into plain insights that you can actually act on, it helps organisations choose smarter options, make best use of resources, and stay competitive in a business world that is getting more and more data driven, every year or so.